Easy In-Browser Exploration of Small Csv Files With WebDataRocks
An example of what we’ll be doing in this article
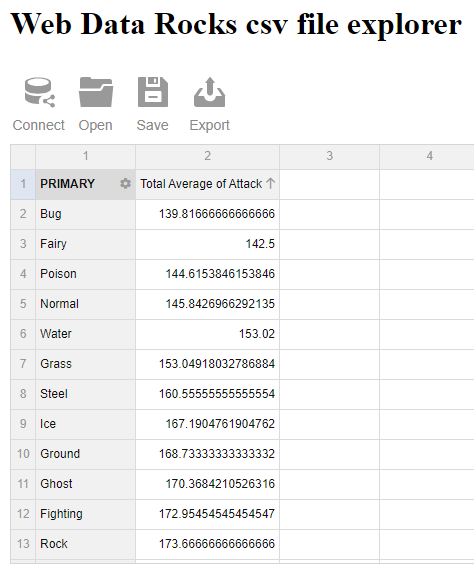
I’ve been meaning to share some thoughts on WebDataRocks for a while now, as it’s helped me find a solution to a fairly minor technical challenge I stumbled upon a few months ago.
To add in a bit of context, exploring the vast online world from a corporate device can be a bit of a hit-and-miss experience. Take the official Irish Data Portal for instance. If you’re a data practitioner that’s based in Ireland, some of the projects that your team is working on could likely benefit from the thousands of datasets that are hosted on that website. But though you might be able to access a preview version of these csv files from your work laptop, chances are that you won’t be allowed to go any further and download them.
Now don’t get me wrong: being extra cautious when it comes to online security is something I understand, and the purpose of this article isn’t to undermine people whose job is to ensure the safety of a company and its employees.
Besides, it’s not like I encounter this type of situation multiple times a day. To be honest I’d be exagerating greatly if I said that not being able to access random csv files found online has had any impact on my work.
I’ll have to admit one thing though: I tend to have some sort of “Really? Well let me see how I can find my way around that problem you just threw at me” type of mindest at times, especially when presented with a simple technical challenge.
So without further ado, let me walk you through my journey through the intricate world of data manipulation packages for the JavaScript ecosystem, and how I eventually came across a tiny but powerful reporting tool named WebDataRocks.
Computer says no, then says yes
Now the last thing I want to do is bore the few readers of this blog with some uninteresting account of my trial-and-error thought process, but at a high level here are the approaches that failed:
- We are behind a proxy that will only allow
httprequests to be made within the context of a web browser. Unfortunately, we can’t open our terminal and write a simple script that fetches an online file using thehttpprotocol. In other words, forget about usingwgetor anything like that. - No exception are made for Visual Studio Code or any other IDE that you can think of.
- Though I personally tend not to trust browser extensions in general, Data Scraper and CSV Reader seem to offer features that could have solved my problems. Another dead end, as we’re not allowed to install extensions in the first place.
But let’s go back for a second to point number 1 and specifically to what I wrote about being able to access most webpages from a browser. Sounds like something we may be able to turn to our advantage, right?
See, I like creating small browser-based tools in my spare time. For instance I’ve been maintaining for years now an arguably ugly but very useful Chart.js-based plot generator. I use it quite frequently to generate interactive visualisations that I can then embed in my presentations. I have also built my own note-taking application, that converts any markdown file into a fancy-looking html page that comes with some cool analytics functionalities. Now all these little utilities have one thing in common (besides being poorly designed and executed): they rely on third-party client-side npm packages. Our approach for today’s little exercise won’t be any different: we’ll try and see how we can access some of the most powerul data manipulation libraries using JSDelivr, a popular content delivery network.
To do this, we’ll be working with the COVID-19 HPSC County Statistics Historic Data csv file from the aforementioned Ireland Data Portal. Our first attempt is going to be very straightforward: we’ll start by creating a blank html canvas and see if we can make a get request for that file:
<script>
    const fetchData = (csv_file) => {
        const request = new Request(csv_file);
        return fetch(request)
            .then(req => {return req.text()})
            .then(result => {console.log(result)});
    }

    const getData = async (csv_file) => {
        const data = await fetchData(csv_file);
        return data;
    }

    getData("https://opendata-geohive.hub.arcgis.com/datasets/d9be85b30d7748b5b7c09450b8aede63_0.csv");
</script>

Good news is, it worked! Bad news is, what we got is pretty much unusable. I doubt we can derive any meaningful insights from that csv file by just outputting our comma-separated values into the developer console. So what we could do instead is use an actual data manipulation package such as Arquero. All we need to do is import the relevant external scripts:
<script src="https://cdn.jsdelivr.net/npm/apache-arrow@latest"></script>
<script src="https://cdn.jsdelivr.net/npm/arquero@latest"></script>
As well as throw in a pair of <div> tags:
<div id="viz"></div>
Now if we want to display the csv file from our html page, we basically have two options. We can either create a request object and use the fetch api:
<script>
    const getDataFrame = (csv_file) => {
        let viz_df = document.getElementById("viz");
        let struct = {
            county: [],
            population: [],
            confirmed_cases: [],
            timestamp: [],
        };

        const request = new Request(csv_file);
        fetch(request)
            .then(req => {return req.text()})
            .then(data => {
                let rows = data.split("\n").slice(1);
                for (let r of rows) {
                    struct["county"].push(r.split(",")[2]);
                    struct["population"].push(r.split(",")[3]);
                    struct["confirmed_cases"].push(r.split(",")[10]);
                    struct["timestamp"].push(r.split(",")[4]);
                    }
                viz_df.innerHTML = aq.table(struct).toHTML({limit: 10})
                }
            );
        return struct;
    }

    getDataFrame("https://opendata-geohive.hub.arcgis.com/datasets/d9be85b30d7748b5b7c09450b8aede63_0.csv")

</script>
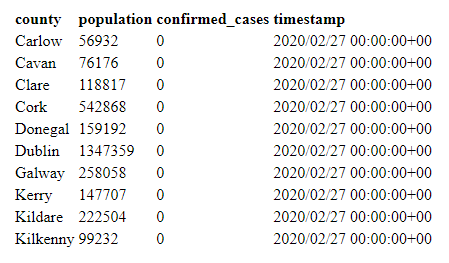
And we get this much nicer and easier to read dataframe object. Or, Arquero has this nice built-in method called loadCSV that we can use to simplify our code:
<script>
    const getDataFrame = async (csv_file) => {
        let viz_df = document.getElementById("viz");
        const dt = await aq.loadCSV(csv_file);
        viz_df.innerHTML = aq
            .table(dt)
            .toHTML({limit: 10})
        }
    getDataFrame("https://opendata-geohive.hub.arcgis.com/datasets/d9be85b30d7748b5b7c09450b8aede63_0.csv")
</script>
Same result. Alternatively, we could swap Arquero for Danfo.js but we should keep in mind that this great package hasn’t been updated in over 3 years. Which means that you probably won’t receive any help if you encounter a bug. Still worth a try if you want my opinion:
We obviously need to import a new package:
<script src="https://cdn.jsdelivr.net/npm/danfojs@1.1.2/lib/bundle.js"></script>
And change our JavaScript code accordingly:
<script>
    const getDataFrame = (csv_file) => {
        let cols = ["CountyName","PopulationCensus16","TimeStamp","ConfirmedCovidCases"]
        dfd.readCSV(csv_file)
            .then(df => {
                df
                .loc( {columns: cols} )
                .head(20)
                .plot("viz")
                .table();
            }
        )
    };

    getDataFrame("https://opendata-geohive.hub.arcgis.com/datasets/d9be85b30d7748b5b7c09450b8aede63_0.csv")
</script>

If you want to learn more about Arquero and Danfo, I wrote two separate articles last year that you might find interesting:
- Arquero: A Great Dataframe Toolkit for JavaScript
- Danfo.js and Dnotebook, a Pandas / Jupyter Combo for JavaScript
Promising, but disappointing
According to its developers, WebDataRocks is a “free web pivot table tool”. I can’t help but laugh at the thought of the devs daring to throw in the word “free” in the description of their product, and you’ll soon see why. Anyway the whole thing sounds like a perfect match for what we’re trying to do here. No statistical analysis, no connecting to a SQL database. After all, what we’re really looking for is an easy way to perform some basic data manipulation on a csv file.
First, let’s create a new html page and paste some html5 boilerplate into it:
<!DOCTYPE html>
<html lang="en">
  <head>
    <meta charset="UTF-8">
    <meta name="viewport" content="width=device-width, initial-scale=1.0">
    <meta http-equiv="X-UA-Compatible" content="ie=edge">
    <title>WebDataRocks csv file explorer</title>
  </head>
  <body>
  </body>
</html>
All we need for WebDataRocks to work are two JavaScript scripts and a CSS file:
<link href="https://cdn.webdatarocks.com/latest/webdatarocks.min.css" rel="stylesheet"/>
<script src="https://cdn.webdatarocks.com/latest/webdatarocks.toolbar.min.js"></script>
<script src="https://cdn.webdatarocks.com/latest/webdatarocks.js"></script>
We can then write a simple <div> element between the <body> tags and add in a bit of text:
<div class="container">
    <div id="header"><h1>Web Data Rocks csv file explorer</h1></div>
    <div id="data-viz"></div>
</div>

I think it’s pretty obvious from the screenshot above that we’re on our way to landing a six figure-web developer job. Time for some more JavaScript:
<script>
    const pivot = new WebDataRocks(
        {
            container: "#data-viz",
            toolbar: true,
            width: "80%"
        }
    );
</script>
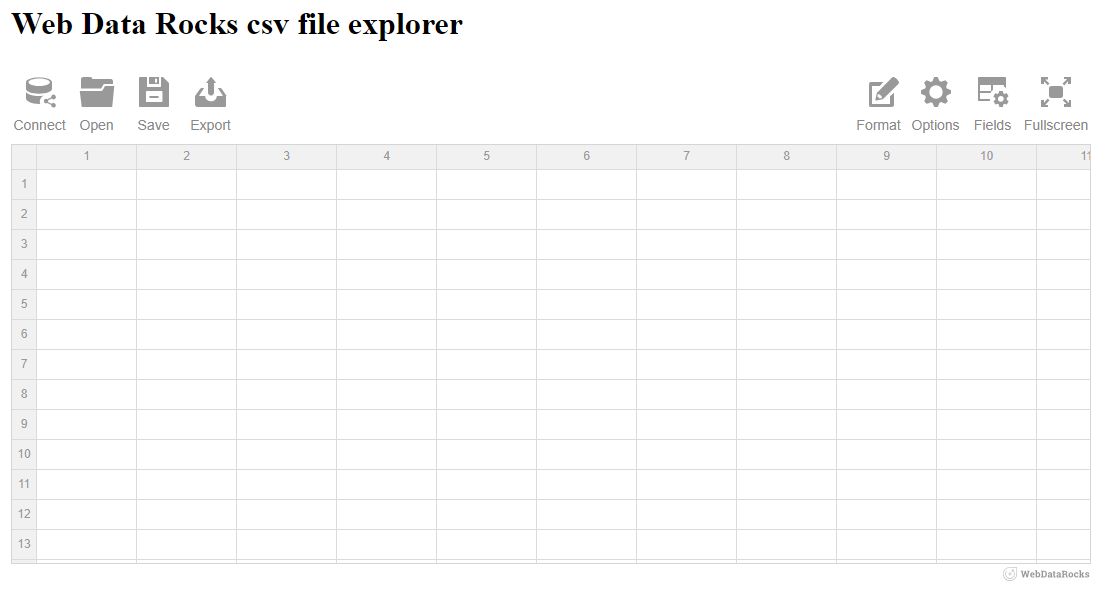
How about that? We get four interactive icons in the top left corner, and four more in the top right one. When we move our mouse cursor over the Connect icon, four new options are made available to us:
- Connect to a local csv file
- Connect to a local json file
- Connect to a remote csv file
- Connect to a local json file
Unfortunately here’s what happens when we click on Connect to a remote csv file and paste in the url pointing to our dataset:
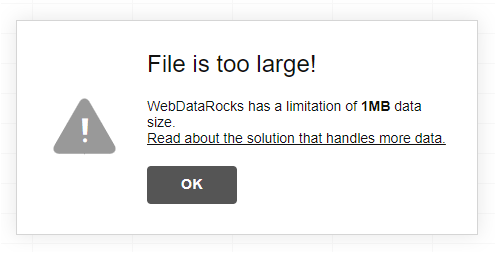
We get this annoying “File is too large!” error as well as an invitation to explore a solution that can handle more data. The said solution of course leads to a commercial website through which any fool potential customer that’s interested in getting that file size limitation removed will be asked to pay an exorbitant fee:

This is why you should always support open-source! Now, the good news is, most of the csv files I deal with tend to be relatively small. So let’s use the Pokemon Go dataset that can be found directly on my GitHub repo. Our next step at this point is to start exploring the fascinating world of Pokemons attributes:
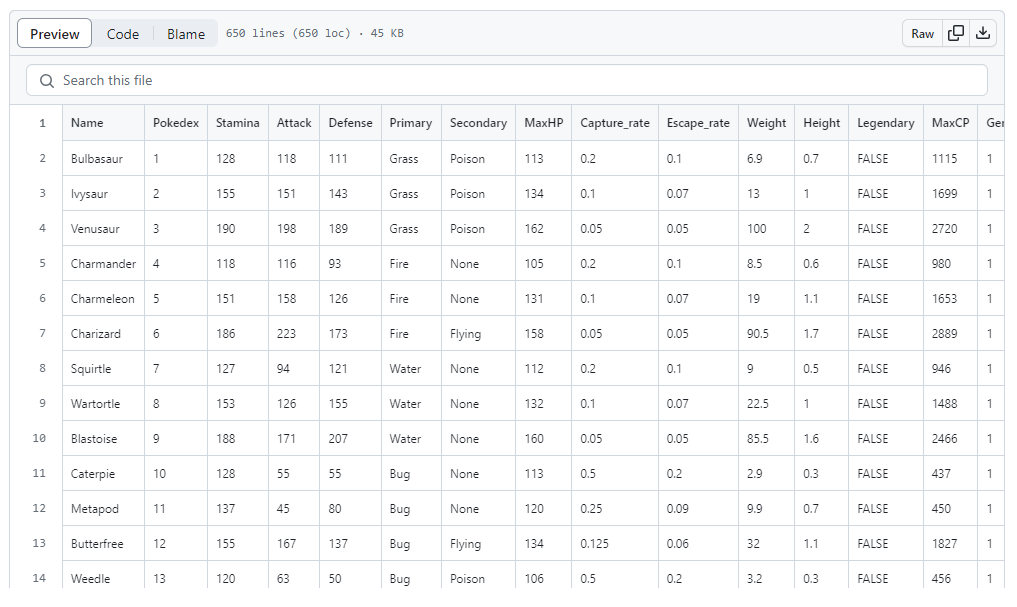
See the Fields icon in the top right corner? Clicking on it will open up a pivot table menu that should look familiar to you if you’re even just a basic Excel user:
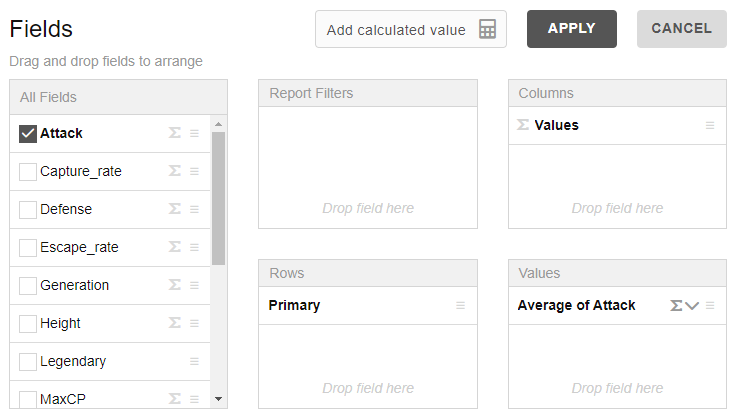
We can do tons of things there, like looking for the average Attack score for the top 10 most common Primary categories:

WebDataRocks also supports various types of visualisations, though the plotting libraries they went for seem a bit strange to me: amCharts, Highcharts, FusionCharts, and Google Charts. Given the audience which I imagine to be primarily business and data analysts, I personnaly believe that Plotly / Observable Plot / Apache eCharts would have been better choices.
Last but not least, I have to admit that the official documentation for WebDataRocks is probably one of the best I’ve seen in a very long time: comprehensive and yet to the point, with very clear and easy-to-understand examples.
Final thoughts
I can’t help but have mixed feelings about what I think could have been one of the very best data exploration packages for the JavaScript ecosystem. WebDataRocks is very easy to use, has a slick UI, and I can think of a lot of people that I know who could be using it on a daily basis. But in my opinion, the fact that it limits its users to a 1mb file size as well at its insane licencing fee are a huge no go. The search for the ideal in-browser data exploration solution continues!