Create a Simple In-Browser SQL Playground With Pyscript
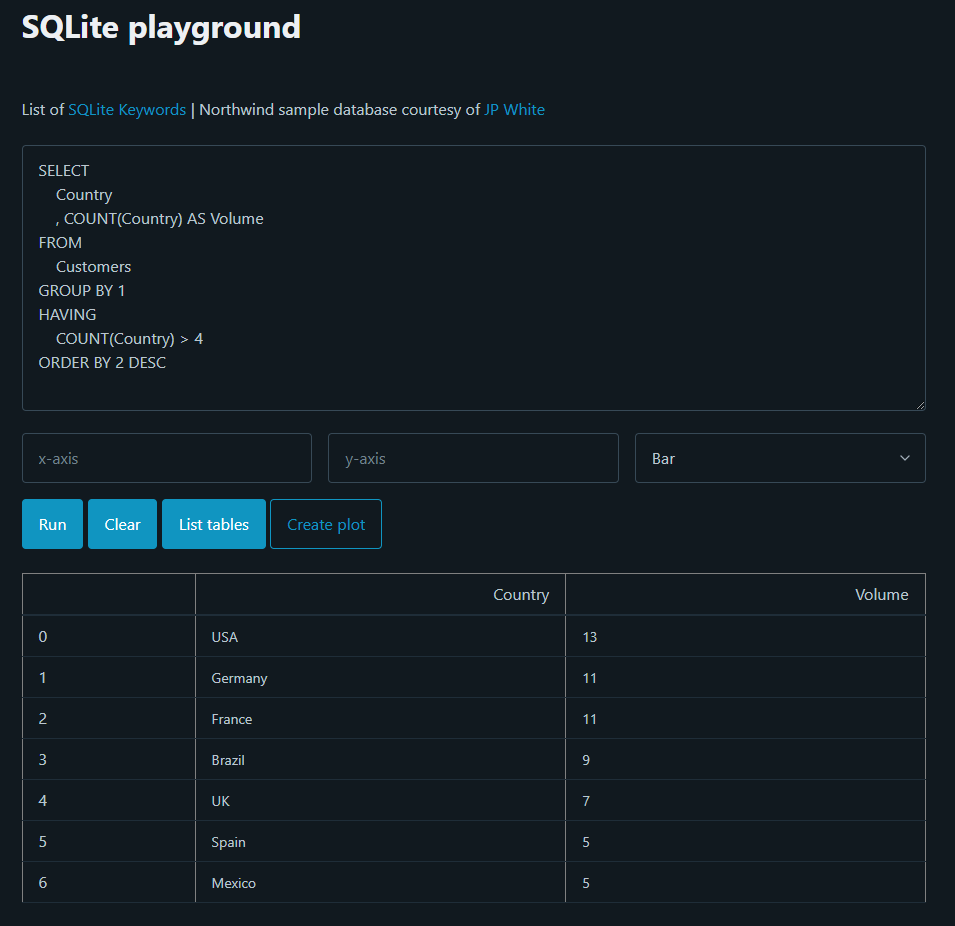
An example of what we’ll be doing in this article

Finding an online SQL playground that’s both free and user-friendly can be a little bit challenging. Most platforms, such as StrataScratch for instance, restrict what free tier users can do, while others hide the querying interface under layers or ads and pop-ups. That being said, it’s still possible to find a couple of high-quality solutions, and I personally really like Coderpad. Their free sandbox environment allows anybody to write some code across a multitude of programming languages:

But what if we tried to create our own SQL playground from scratch? How difficult would that be? What I have in mind is nothing fancy really: no linter, no auto-complete, no syntax highlighting, etc.. And above all, one file. Nothing to install, no command to run. Just a single file, that anybody can double-click on and open in their browser.
Now, we could go the easy route, and write a simple Flask web application if we chose Python (I highly recommend this video from TechWithTim if you want to know more). Alternatively, we could try and directly run SQLite.js from the browser if we decided to use JavaScript instead.
I wrote in October last an article entitled PyScript, Aka Python in the Browser and while I experienced a couple of small issues, being finally able to run Python directly from an html file felt really exciting.
For today’s article, we’re going to see how we can create a simple SQL playground using PyScript in less than x lines of code.
Files and libraries in PyScript
One of the main issues I encountered while working with PyScript last year, was how difficult it felt to access either local or remote files. As PyScript creates its own virtual runtime, getting my scripts to interact with the “outside world” turned out to be more challenging than it had initially seemed. So why come back to it now you might ask? Well I recently read that the way the main configuration tags work has drastically improved, making importing libraries easier and allowing users to do some fancy stuff like load local and remote files. Without further ado, let’s see how PyScript’s new <py-config></py-config> tags now work:
- We can now simply pass (almost) any library that we want to import as a list of strings:
<py-config>
      packages = ["whichever library you want to import as long as it's supported"]
</py-config>
- Accessing local files has been made much easier thanks to the
[[fetch]]configuration argument:
<py-config>
      [[fetch]]
      files = ["./whatever_file_you_want_to_work_with.extension"]
</py-config>
- Finally, working with remote files looks quite similar to loading local files, except that we have to break down the url path as follow:
<py-config>
      [[fetch]]
      from = "the url of the file that you want to access"
      files = ["the file itself"]
</py-config>
With this out of the way, we can now start loading the libraries that we need as well as a small version of the legendary Northwind database for Microsoft Access 2000, that I found on JP White’s GitHub page. This guy has quite a few interesting repositories, and I highly recommend you to check out his work.
<py-config>
      packages = ["pandas","sqlalchemy","matplotlib","seaborn"]
      [[fetch]]
      from = "https://raw.githubusercontent.com/jpwhite3/northwind-SQLite3/master/dist/"
      files = ["northwind.db"]
</py-config>
Now, what hasn’t changed since the article I wrote last year, is that we will still be writing all our Python code within a pair of <py-script></py-script> tags, which will be placed within the <body></body> elements of our html page. But before we get there, let’s first focus on our user interface.
A bit of HTML and CSS first
If you’re a frequent reader of this website, you will probably expect us to use a minimalist css framework, and as I would hate to disappoint, this is exactly what we’re going to do! More specifically, we’re going to rely on Pico.css to do all the css formatting for us. We won’t be spending too much time on how to build a simple webpage with Pico.css, as I also wrote an article on my favourite css frameworks last year.
First, simply create an html file using an html5 boilerplate, and make sure that your <head></head> tags look like this:
<head>
    <meta charset="utf-8">
    <link rel="stylesheet" href="https://pyscript.net/latest/pyscript.css">
    <link rel="stylesheet" href="https://unpkg.com/@picocss/pico@latest/css/pico.min.css">
    <script defer src="https://pyscript.net/latest/pyscript.js"></script>
    <py-config>
      packages = ["pandas","sqlalchemy","matplotlib","seaborn"]
      [[fetch]]
      from = "https://raw.githubusercontent.com/jpwhite3/northwind-SQLite3/master/dist/"
      files = ["northwind.db"]
    </py-config>
    <title>SQL playground</title>
  </head>
Alright, it’s now time to think about what we want our webpage to look like. In other words, what basic features should our playground offer?
- It should of course have a text area for us to write our SQL code
- We’ll need a couple of buttons: one to run our queries, and another one to clear the output
- As we’ll be working with a database, we might also want to find a way to list the tables that the Northwind database contains
- What if we also added some basic plotting functionalities? Just an option to pick between a bar and a line chart, with the possibility to manually type in our x and y axis
- And of course, some empty
<div></div>below what we just listed, to output our query results and our plots
Even though we’re not web developers, This shouldn’t be too complicated:
<body>
    <main>
      <div class="container">
        <h1>SQLite playground</h1>
        <p>
          List of <a href="https://www.sqlite.org/lang_keywords.html" target="_blank">SQLite Keywords</a>
          | Northwind sample database courtesy of <a href="https://github.com/jpwhite3/northwind-SQLite3" target="_blank"> JP White</a>
        </p>
      </div>
      <div class="container">
        <textarea id="sql_query" name="name" rows="10" placeholder="Enter your SQL query here"></textarea>
      </div>
      <div class="container">
        <div class="grid">
          <input type="text" id="xaxis" name="firstname" placeholder="x-axis">
          <input type="text" id="yaxis" name="firstname" placeholder="y-axis">
          <select id="plot_choice">
            <option>Bar</option>
            <option>Line</option>
          </select>
        </div>
      </div>
      <div class="container">
        <a href="#" id="fetch_query" role="button">Run</a>
        <a href="#" id="clear_query" role="button">Clear</a>
        <a href="#" id="list_tables" role="button">List tables</a>
        <a href="#" id="create_plot" class="outline" role="button">Create plot</a>
      </div>
      <br>
      <section>
        <div class="container" id="viz"></div>
      </section>
    </main>

    <py-script>
    </py-script>
  </body>
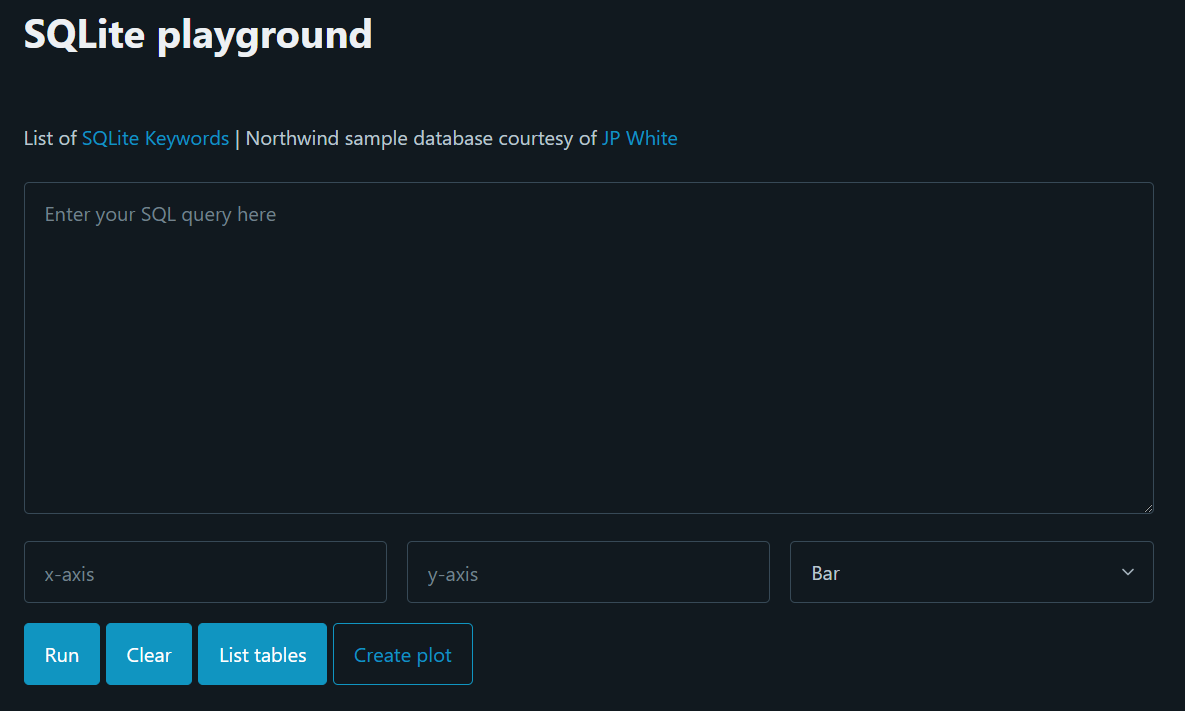
Let’s paste all the above code into our playground.html file and open it in our browser:

That should do the job!
SQLAlchemy and Pandas, best friends forever
JP White’s Northwind database was created for SQLite, which means that we can either use SQLAlchemy or SQLite3 to access our data. Either of these two libraries will work, but we’re going to pick SQLite3 for our playground, for the sole reason that I’m pretty familiar with this package:
<py-script>
    import pandas as pd
    import sqlite3
    import matplotlib.pyplot as plt
    import seaborn as sns
    from pyodide.http import open_url
    from js import document, Element
    from pyodide.ffi import create_proxy
</py-script>
To load a SQLite database into SQLAlchemy, we first need to create a connector. We can then write a SQL query in string format and pass it as an argument within Pandas’s .read_sql_query() method, followed by our connector. If you want to create your own database instead of using a pre-existing one, you can follow my tutorial here.
con = sqlite3.connect("northwind.db")
df = pd.read_sql_query("SELECT * FROM Users LIMIT 5", con)
You might wonder how we’re going to fetch our users’ queries, and pass them through a getDataframe() function when the “run” button is pressed. To do so, we’re going to use a method of the EventTarget interface that is called an event listener. If you’re not too familiar with web development, let’s imagine a scenario where we have a button with an id attribute of "i_am_a_button", and a pair of <div></div> tags with the id attribute of "i_am_a_div". Though the <div> element is by default empty, we want it to display the word pizza when a user clicks on the button. In JavaScript, we would probably write something like this:
let a = document.getElementById("i_am_a_button");
let b = document.getElementById("i_am_a_div");

const getCompleted = () => {
   b.innerHTML = "pizza";
 }

a.addEventListener("click", getCompleted);
Well, PyScript also supports event listeners, through the syntax is obviously slightly different:
from pyodide import create_proxy

a = document.getElementById("i_am_a_button")
b = document.getElementById("i_am_a_div")

def getCompleted(*args, **kwargs):
    b.innerHTML = ""

a.addEventListener("click", create_proxy(getDataframe))
You’ll notice that that we called the getDataframe function without using parentheses, and that we allowed for the passing of an unspecified number of arguments to our function.
Back to our SQL playground, here’s how we going to fetch our users’ queries, turn them into a Pandas dataframe object, and output the result:
def getDataframe(*args, **kwargs):
    document.getElementById("viz").innerHTML = ""
    user_query = document.getElementById("sql_query").value
    con = sqlite3.connect("northwind.db")
    try:
        df = pd.read_sql_query(user_query, con)
    except:
        df = "No data to query"
    con.close()
    pyscript.write("viz",df)

query_button = document.getElementById("fetch_query")
query_button.addEventListener("click", create_proxy(getDataframe))
If you’re wondering what pyscript.write() does, remember earlier on when we built our UI and created the following tags:
<div class="container" id="viz"></div>
Let’s write a simple SQL query and see what happens!

Now, the button that our users will click on to clear the output of their queries follows the same logic, but is even simpler:
def getClear(*args, **kwargs):
    document.getElementById("viz").innerHTML = ""

clear_button = document.getElementById("clear_query")
clear_button.addEventListener("click", create_proxy(getClear))
In order to get SQLite3 to show a list of all the tables within a database, we need to run the following query:
SELECT name FROM sqlite_master WHERE type='table';
Doing so returns a list of tuples, with the name of each table located at the first indexing position (so, 0) of each tuple. Though we could get Pyscript to send a list of tables to our "viz" <div> tags, it will look considerably better if we cast this list into a string instead:
def getTables(*args, **kwargs):
    document.getElementById("viz").innerHTML = ""
    con = sqlite3.connect("northwind.db")
    cur = con.cursor()
    cur.execute("SELECT name FROM sqlite_master WHERE type='table';")
    tables = []
    for table in cur.fetchall():
        tables.append(table[0])
    con.close()
    pyscript.write("viz"," | ".join(tables))

tables_button = document.getElementById("list_tables")
tables_button.addEventListener("click", create_proxy(getTables))

Basic plots
As discussed earlier, we want to allow our users to visualise the output of their query using some simple bar and line charts. Though we’ll be relying on Matplotlib and Seaborn to generate our charts, any other Python data visualisation library will work just as fine.
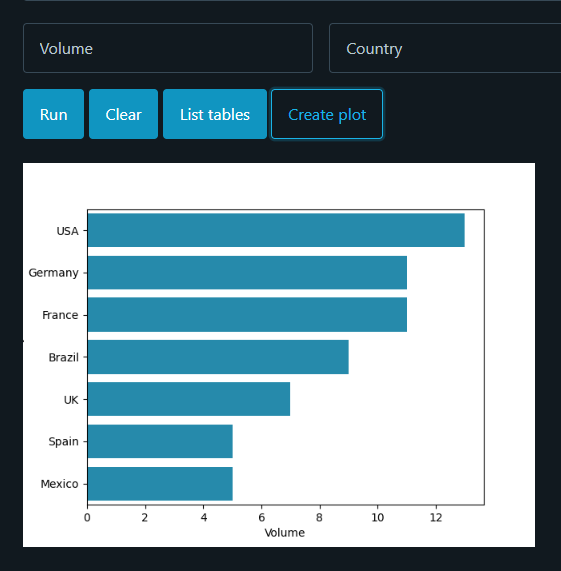
Earlier in this article, we created an html dropdown menu and gave it the id= value of "plot_choice", plus a couple of <input></input> tags and a simple Create plot button:

The following getPlot() function will fetch our users’ input just like the getDataFrame() function did, simply adding some if and elif statements to determine the type of chart that our users want to output:
def getPlot(*args, **kwargs):
    document.getElementById("viz").innerHTML = ""
    user_query = document.getElementById("sql_query").value
    x = document.getElementById("xaxis").value
    y = document.getElementById("yaxis").value
    choice = document.getElementById("plot_choice").value
    con = sqlite3.connect("northwind.db")
    df = pd.read_sql_query(user_query, con)
    plt.figure()
    if choice == "Bar":
        sns.barplot(
            data=df,
            x=x,
            y=y,
            orient="h",
            color="#1095c1"
            )
    elif choice == "Line":
        sns.lineplot(
            data=df,
            x=x,
            y=y,
            marker="o",
            markersize=17,
            alpha=0.3,
            linewidth=5,
            color="#1095c1"
         )
    pyscript.write("viz",plt)

plot_button = document.getElementById("create_plot")
plot_button.addEventListener("click", create_proxy(getPlot))

Alright, our getPlot() function seems to work, but the plots it returns don’t match the look and feel of our playground. To solve this issue, we’re going to define a few high-level plotting parameters using Matplotlib’s rcParams configuration namespace:
rc = {
    "axes.grid" : False,
    "axes.edgecolor": "11191f",
    "axes.facecolor": "11191f",
    "axes.labelcolor": "11191f",
    "figure.facecolor":"11191f",
    "figure.edgecolor": "11191f",
    "font.family":"sans-serif",
    "grid.color": "lightgrey",
    "xtick.color": "11191f",
    "xtick.bottom": False,
    "xtick.labelbottom": True,
    "xtick.labelcolor": "white",
    "ytick.color": "11191f",
    "ytick.labelcolor": "white",
    "ytick.left": False,
    "ytick.labelleft": True
  }
plt.rcParams.update(rc)
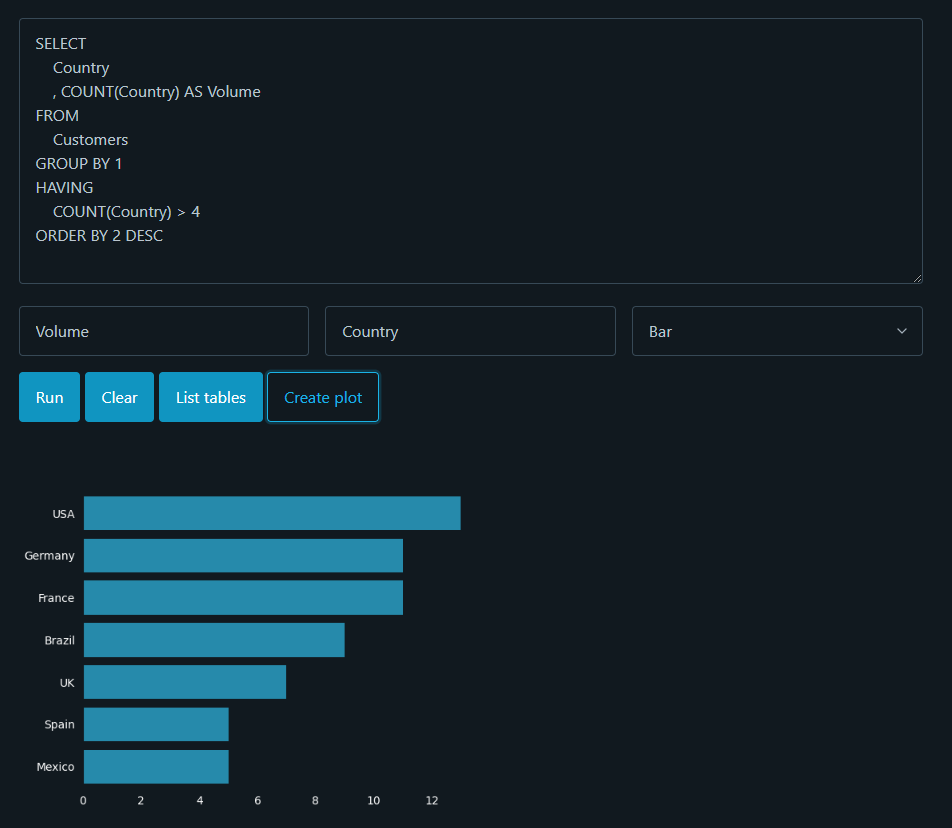
Let’s reload our html file and run the same query again:

We could do with a better font, but that’s arguably much better!
Full code
If you want to try the playground that we just built, simply paste the following code into an html file:
<!DOCTYPE html>
<html lang="en" dir="ltr" data-theme="dark">
  <head>
    <meta charset="utf-8">

    <link rel="stylesheet" href="https://pyscript.net/latest/pyscript.css">
    <link rel="stylesheet" href="https://unpkg.com/@picocss/pico@latest/css/pico.min.css">
    <!-- <link href="https://unpkg.com/bonsai.css@latest/dist/bonsai.min.css" rel="stylesheet"> -->

    <script defer src="https://pyscript.net/latest/pyscript.js"></script>
    <py-config>
      packages = ["pandas","sqlalchemy","matplotlib","seaborn"]
      [[fetch]]
      from = "https://raw.githubusercontent.com/jpwhite3/northwind-SQLite3/master/dist/"
      files = ["northwind.db"]
    </py-config>
    <title>SQL playground</title>
  </head>
  <body>

    <main>
      <div class="container">
        <h1>SQLite playground</h1>
        <p>
          List of <a href="https://www.sqlite.org/lang_keywords.html" target="_blank">SQLite Keywords</a>
          | Northwind sample database courtesy of <a href="https://github.com/jpwhite3/northwind-SQLite3" target="_blank"> JP White</a>
        </p>
      </div>
      <div class="container">
        <textarea id="sql_query" name="name" rows="10" placeholder="Enter your SQL query here"></textarea>
      </div>
      <div class="container">
        <div class="grid">
          <input type="text" id="xaxis" name="firstname" placeholder="x-axis">
          <input type="text" id="yaxis" name="firstname" placeholder="y-axis">
          <select id="plot_choice">
            <option>Bar</option>
            <option>Line</option>
          </select>
        </div>
      </div>
      <div class="container">
        <a href="#" id="fetch_query" role="button">Run</a>
        <a href="#" id="clear_query" role="button">Clear</a>
        <a href="#" id="list_tables" role="button">List tables</a>
        <a href="#" id="create_plot" class="outline" role="button">Create plot</a>
      </div>
      <br>
      <section>
        <div class="container" id="viz"></div>
      </section>
    </main>

    <py-script>
      # http://localhost:8000/playground.html
      # python -m http.server
      # #11191f
      # from = "Northwind_small.sqlite"
      # to_file = "db.sqlite"

      import pandas as pd
      import sqlite3
      import matplotlib.pyplot as plt
      import seaborn as sns
      from pyodide.http import open_url
      from js import document, Element
      from pyodide.ffi import create_proxy

      rc = {
        "axes.grid" : False,
        "axes.edgecolor": "11191f",
        "axes.facecolor": "11191f",
        "axes.labelcolor": "11191f",
        "figure.facecolor":"11191f",
        "figure.edgecolor": "11191f",
        "font.family":"sans-serif",
        "grid.color": "lightgrey",
        "xtick.color": "11191f",
        "xtick.bottom": False,
        "xtick.labelbottom": True,
        "xtick.labelcolor": "white",
        "ytick.color": "11191f",
        "ytick.labelcolor": "white",
        "ytick.left": False,
        "ytick.labelleft": True
      }
      plt.rcParams.update(rc)

      def getDataframe(*args, **kwargs):
        document.getElementById("viz").innerHTML = ""
        user_query = document.getElementById("sql_query").value
        con = sqlite3.connect("northwind.db")
        try:
          df = pd.read_sql_query(user_query, con)
        except:
          df = "No data to query"
        con.close()
        pyscript.write("viz",df)

      def getClear(*args, **kwargs):
        document.getElementById("viz").innerHTML = ""

      def getTables(*args, **kwargs):
        document.getElementById("viz").innerHTML = ""
        con = sqlite3.connect("northwind.db")
        cur = con.cursor()
        cur.execute("SELECT name FROM sqlite_master WHERE type='table';")
        tables = []
        for table in cur.fetchall():
          tables.append(table[0])
        con.close()
        pyscript.write("viz"," | ".join(tables[4:]))

      def getPlot(*args, **kwargs):
        document.getElementById("viz").innerHTML = ""
        user_query = document.getElementById("sql_query").value
        x = document.getElementById("xaxis").value
        y = document.getElementById("yaxis").value
        choice = document.getElementById("plot_choice").value
        con = sqlite3.connect("northwind.db")
        df = pd.read_sql_query(user_query, con)
        plt.figure()
        if choice == "Bar":
          sns.barplot(
            data=df,
            x=x,
            y=y,
            orient="h",
            color="#1095c1"
            )
        elif choice == "Line":
          sns.lineplot(
            data=df,
            x=x,
            y=y,
            marker="o",
            markersize=17,
            alpha=0.3,
            linewidth=5,
            color="#1095c1"
            )
        pyscript.write("viz",plt)

      query_button = document.getElementById("fetch_query")
      clear_button = document.getElementById("clear_query")
      tables_button = document.getElementById("list_tables")
      plot_button = document.getElementById("create_plot")
      query_button.addEventListener("click", create_proxy(getDataframe))
      clear_button.addEventListener("click", create_proxy(getClear))
      tables_button.addEventListener("click", create_proxy(getTables))
      plot_button.addEventListener("click", create_proxy(getPlot))
    </py-script>
  </body>
</html>
Enjoy!