Counting Elements in Pandas
Many programming languages will allow developers to count the number of elements within a list / array by looping through that list, and checking if each of the element is present as a key within a dictionary or map.
names = ["Ana","John","Ana","Ana","Mary","John"]

def countNames(data):
    result = {}
    for name in names:
        if name in result:
            result[name] += 1
        else:
            result[name] = 1
    print(result)

countNames(names)
This process can be a bit tedious, and to sort the dictionary by the most commonly found element, we have to add another line of code before our print() statement:
result = sorted(result.items(), key=lambda x: x[1], reverse=True)
The Collections module
Luckily enough, Python has this great library named Collection, and we can use its Counter subclass for counting hashable objects.
from collections import Counter

names = ["Ana","John","Ana","Ana","Mary","John"]

def countNames(data):
    result = Counter(data)
    print(result)

countNames(names)
Counter will return a dictionary that is already sorted by the highest value.
Now, what makes Counter even more valuable, is the fact we can specify how many key and value pairs we want the function to return:
from collections import Counter

names = ["Ana","John","Ana","Ana","Mary","John"]

def countNames(data,howmany):
    counted = Counter(data)
    for k,v in counted.most_common(howmany):
        print(f"{k:<5} | {v:>3}")

countNames(names,2)

In the example above, we used the .most_common() method to specify how many key and value pairs we wanted our function to return, and we used f-strings- to justify the text that is printed on the screen.
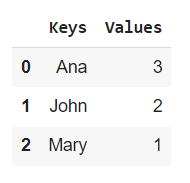
We can also very easily pass our keys and values into a Pandas dataframe, which will enable us to use some of Pandas’ most useful features.
from collections import Counter
import pandas as pd

names = ["Ana","John","Ana","Ana","Mary","John"]

def countNames(data,howmany):
    counted = Counter(data)
    keys = [k for k,v in counted.most_common(howmany)]
    values = [v for k,v in counted.most_common(howmany)]
    dataframe = pd.DataFrame(
        {"Keys":keys,
         "Values":values
         }
        )
    return dataframe

countNames(names,3)

Pandas’ built-in methods
But what about counting the variables that are present within a Pandas serie?
We can either use the Collections module again, or rely on some Pandas’ methods such as .value_counts() or .groupby().
The following examples will be based, once again, on a .csv rendering of the Pokedex.
Let’s first load our dataframe:
def getDataFrame(url_address,ind):
    df = pd.read_csv(url_address)
    return df

df = getDataFrame("https://raw.githubusercontent.com/julien-blanchard/dbs/main/pokemon_go.csv")
df.sample(5)

What makes this dataset interesting is its good balance between categorical and numerical values, which will come in handy later on when we start using Pandas’ .groupby() method.
But before we get there, let’s explore what we can do with the .value_counts() method first.
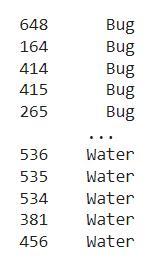
df["Primary"].sort_values()

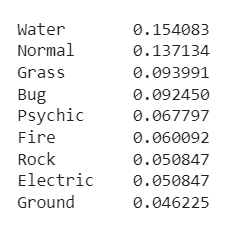
Arguably, this is very similar to what we saw earlier with the Collections module. However, the .value_counts() method can take arguments that can prove very useful when analysis large chunks of data.
df["Primary"].value_counts(
    normalize=True,
    ascending=False,
    dropna=False
    ).

In the example above we have normalised our values, sorted them by highest first, and ignored NULL variables. The .value_counts() method will also allow you to perform data binning, pick your sorting algorithm, or choose where you want NULL values to show. Feel free to read the official documentation for more.
As a matter of fact, the .value_counts() method can be extremely useful for chaining, and to create plots.
But what if we want to count values over multiple series? Let’s take another look at our Pokedex dataset.

Value_counts(), or groupby()?
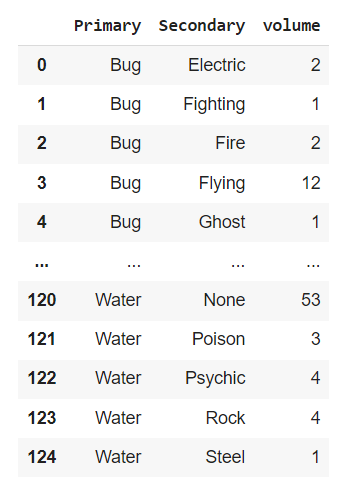
Now, say we want to count how many iterations of df["Secondary"] are present within each unique df["Primary"] value. This is where we want to use Pandas’ .groupby() method.
def getMultiCount(data,serie1,serie2):
    d = data.groupby([serie1,serie2])[[serie2]].count()
    d.rename(columns={serie2:"volume"}, inplace=True)
    d.reset_index(drop=False, inplace=True)
    return d

getMultiCount(df,"Primary","Secondary")

The first line within our function is pretty simple: we are aggregating two series, and then specifying that the .count() method will apply to the second serie. This will create a multi-index dataframe, which, as much as I love Pandas, can be a bit of a mess to deal with. To flatten the name of our series, we first want to rename the new serie we just created and that contains the aggregated numerical values. Having two series named Secondary would trigger an error.
Once this is done, we can simply use the .reset_index() method and return our aggregated dataframe.
Last but not least, if you simply want to add to your dataframe a new serie that counts the unique value within another serie (though you probably don’t want to do that), you can also use the .groupby() method:
df["Primary_count"] = df["Primary"].groupby(df["Primary"]).transform("count")