Starboard.gg, and Other Notebook Environments for Non-Python Data Science: Part I
Have you ever wondered what makes a language be a good fit for a particular space or not? Its design choices, overall syntax, and to a lesser extent speed and performance are arguably some of the first elements that you’ll likely hear when asking this question around. I personally think that tooling and the landscape of existing dependencies also play a huge role in the adoption of a given language by a specific community. As in, most people (including myself) are more likely to learn a new language if it provides them with easy-to-use standard or third-party libraries and frameworks.
Can we maybe go into a little bit more details as to what these tools might be for the data analytics and data science space? At the bare minimum, we’re looking for some ways to load data, transform this data, as well as a couple of statistics-oriented libraries. Nice-to-haves would include ways to visualise and interpret all of that data.
That’d probably be enough to get started. I however believe that we’d be missing on something that’s equally as important, if not more: the ability to share all of that work. The truth is, all the insights we are able to draw from data, all the models we build, are probably much less impactful if we cannot find ways to showcase what we have done and receive constructive feedback that we can build upon.
And this is exactly what notebooks are for: prototyping, sharing insights and interpretations, getting feedback. IDEs and notebooks don’t play the same role, and don’t serve the same purposes. All the places where I have had the chance to work understood the importance of collaborative work, and most of them provided their data practitioners with tools that enabled them to effortlessly make their work available to both technical and non-technical audiences.
This is why most data analytics teams now work with tools such as Mode (TikTok) or Apache Superset (Airbnb). R users have a somewhat different ecosystem with both R Studio and R Shiny. JavaScript has Observable, and though I’m not really familiar with the Julia language, IJulia seems to be a pretty solid Jupyter-based interactive environment. Google Colaboratory has been my go-to solution for a good few years now. I love its simplicity, and the fact that I can share my work with friends and workmates alike.
In today’s article we’re going to primarily focus on Starboard.gg, a fairly new entry into the competitive world of data analytics and data science notebooks. Over the next few weeks, we’ll then show some other great notebook environments, this time oriented towards programming languages that most people wouldn’t immediately think of when starting a data science project from scratch.
Our plan
As the purpose of this series of articles is to show that there’s a place in the data science world for languages other than Python and R, we’re going to have to get a bit away from our comfort zone. This means being open to languages and environments that we’re not too familiar with. The goods news is, we’re on this boat together! As I’m a pretty bad data analyst, an even worse data scientist and a crap coder in general, we won’t be doing anything too complicated. No advanced data manipulation, no statistical modelling. Just the basics.
Please note that I have ignored Jupyter kernels, such as:
- Xeus for Lua
- iRuby for Ruby
- Gophernotes for Go
- Clojupyter for Clojure
- etc..
Or IDE plug-ins, like:
Without any further ado, let’s get started!
Starboard
I’ve always struggled to understand why so many programmers hate JavaScript. I personally very much like the language. Most likely because I’m not really a programmer, but also because as discussed in the opening lines of this article, I don’t really care what JavaScript looks like. I just love what it allows me to do.
There have been several attempts to implement a Node kernel onto some Jupyter-like solutions, like DataForge did a few years ago for instance. We also briefly discussed Dnotebook last year in this article. But if you ask me, the most mature and easy-to-use platform that I have found is without a doubt Starboard.
Starboard was created in 2020, and currently has over 1,100 stars on GitHub. You might also be happy to know that it supports both Python and JavaScript. Oh and, Starboard is fully open-source. So as of September 2023, using is entirely free!
With this out of the way, we can start thinking about how we’re going to evaluate whether a notebook environment could be a good fit for basic data science projects or not. I personally believe that it should allow us to easily:
- Load data from an API
- Load data from a CSV file
- Use a dataframe library
- Use an NLP package
- Create some simple data visualisation
To create our first notebook, let’s head over to starboard.gg and create an account. Our first line of code is going to be pretty simple:
const greeting = "Hello, world!";
console.log(greeting);
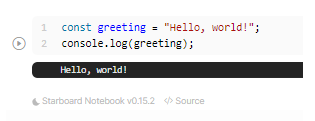
Alright, we just printed hello world!. That’s all great, but we’re still pretty far from launching an AI startup here. Now, what’s really great about Starboard is that we can:
- in theory use any package that is available on either of the popular content delivery networks without having to install anything. I wrote in theory because I have faced import issues with several packages
- create html cells and fill them with any element we want to, which will in turn help us create some cool visualisations just like if we were in a browser
Actually, each individual cell can be set to render a bunch of different languages, including:
- plain JavaScript
- ES modules
- HTML
- CSS
- etc..
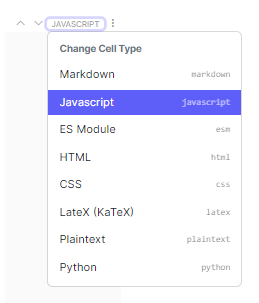
All these cell types are going to come in handy when we start outputting a dataframe object or create some charts. But before we get there, let’s see how we can load a package. We can pick either of the following two options:
- A plain JavaScript cell:
await import ("name of the NPM package goes here")
- An ES module cell:
import {a,b,c} from "name of the NPM package goes here";
Please note that ES module cells support both approaches, so we’ll be relying on them mostly. Let’s import the D3 package and see how we can leverage it to load and parse a small csv file:
import {csvParse, csvParseRows} from "https://cdn.skypack.dev/d3-dsv@3";

const fetchData = async (csv_file) => {
  return fetch(csv_file).then(
    d => {return d.text()}
  )
};

const getData = (data) => {
  const temp = csvParse(data);
  let struct = {
    first_name: [],
    last_name: [],
    age: [],
    country: [],
    occupation: []
  };
  for (let t in temp) {
		struct["first_name"].push(Object.values(temp[t])[0]);
    	struct["last_name"].push(Object.values(temp[t])[1]);
    	struct["age"].push(Object.values(temp[t])[2]);
    	struct["country"].push(Object.values(temp[t])[3]);
    	struct["occupation"].push(Object.values(temp[t])[4]);
  }
  return struct;
}

const csv_data = await fetchData("https://raw.githubusercontent.com/julien-blanchard/datasets/main/fake_csv.csv");
const parsed = getData(csv_data);
console.log(parsed);

Well that worked, but the result isn’t very readable. What if we tried to render this Object as an Arquero dataframe instead? To do this, we first need to create an html cell and give it an id:
<div id="viz"></div>
Now that we have a cell that’s going to behave slightly like like an html page would, we can pass our parsed csv file into Arquero’s toHTML() method and output the first 10 rows:
await import("https://cdn.jsdelivr.net/npm/arquero@latest");

const getTable = (data,where) => {
  const dframe = aq.table(data);
  let viz_df = document.getElementById(where);
  viz_df.innerHTML = aq.table(dframe).toHTML({limit: 10})
}

const csv_data = await fetchData("https://raw.githubusercontent.com/julien-blanchard/datasets/main/fake_csv.csv");
const parsed = getData(csv_data);
getTable(parsed,"viz");
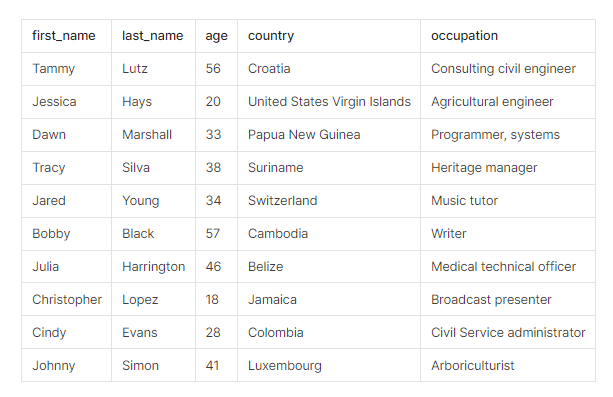
That’s much better, right!
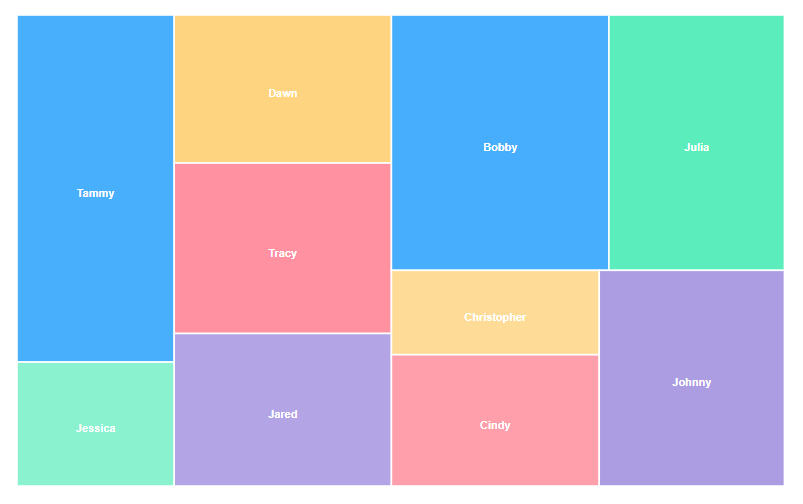
What could we do next? Well, we could try and visualise this dataframe, using another great open-source library named ApexCharts:
import {csvParse, csvParseRows} from "https://cdn.skypack.dev/d3-dsv@3";
await import("https://cdn.jsdelivr.net/npm/apexcharts");
Our getData() function has to be slightly modified for this to work:
const fetchData = async (csv_file) => {
  return fetch(csv_file).then(
    d => {return d.text()}
  )
};

const getData = (data) => {
  let struct = new Array();
  let parsed = csvParse(data);
  let parsed_values = Object.values(parsed).slice(0,5)
  for (let p of parsed_values) {
    struct.push(
      {
        x: p["First_name"],
        y: p["Age"]
      }
    )
  }
  return struct;
}

const csv_data = await fetchData("https://raw.githubusercontent.com/julien-blanchard/datasets/main/fake_csv.csv");
const plot_data = await getData(csv_data);
console.log(plot_data);
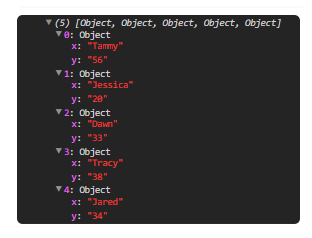
Next comes a brand new html cell, with a slightly different id= value than its predecessor:
<div id="viz2"></div>
The treemap chart we’re about to create certainly won’t win any data visualisation award, but ApexChart’s official documentation offers some very nice sample plots that I’m sure we could take inspiration from to create some much better-looking viuals:
const getChart = (data) => {
  let options = {
    chart: {
      type: "treemap"
    },
    plotOptions: {
      treemap: {
        distributed: true
      }
    },
    series: [
      {
      	data: data
      }
      ]
  }
  let chart = new ApexCharts(document.querySelector("#viz2"), options);
  chart.render();
}

const csv_data = await fetchData("https://raw.githubusercontent.com/julien-blanchard/datasets/main/fake_csv.csv");
const plot_data = await getData(csv_data);
await getChart(plot_data)

There are literally tons of things that we could do at this point. If you’re new to JavaScript and you’re wondering what packages you could start experimenting with, here are a few suggestions:
Natural Language Processing:
Data visualisation:
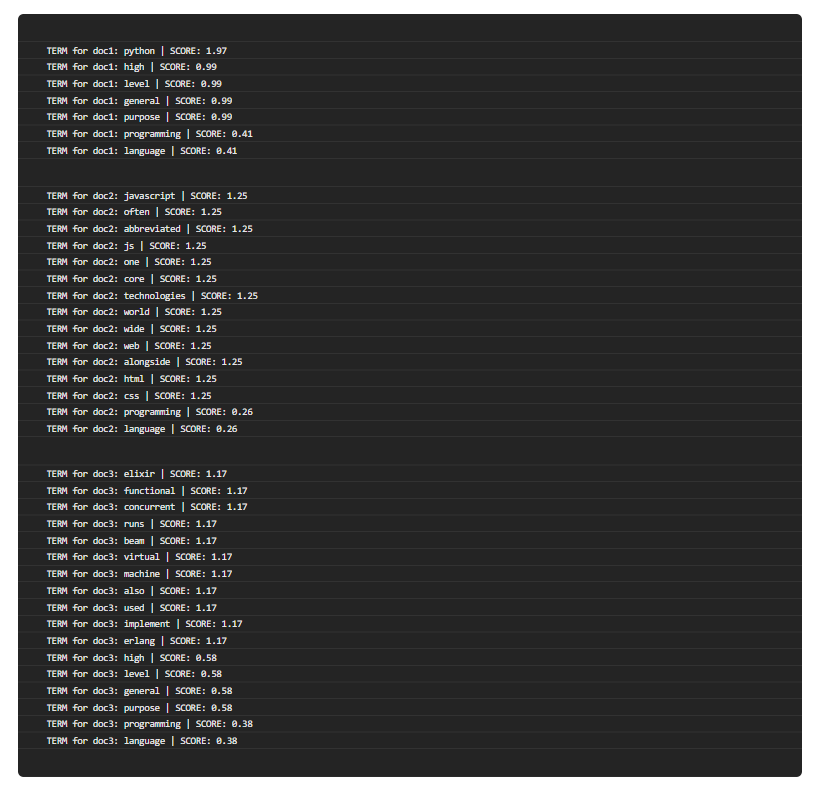
Let’s for instance calculate the tf-idf score for a random corpus using the Tiny-TFIDF package. Our corpus is made of three short documents that I scraped from Wikipedia, and should be stored in the following format:
let docs = [
    "Python is a high-level, general-purpose programming language.",
    "JavaScript, often abbreviated as JS, is a programming language that is one of the core technologies of the World Wide Web, alongside HTML and CSS.",
    "Elixir is a functional, concurrent, high-level general-purpose programming language that runs on the BEAM virtual machine, which is also used to implement the Erlang programming language."
  ];
What comes next is pretty straightforward, we’re just formatting the outputted arrays of arrays to mke the results easier to read:
const tinytfidf = await import("https://cdn.skypack.dev/tiny-tfidf");

const corpus = new tinytfidf.Corpus(
  ["doc1", "doc2", "doc3"],
  docs
);

const getTfIfPerDoc = (data,whichdoc) => {
  console.log("\n")
  let results = data.getTopTermsForDocument(whichdoc);
  for (let t in results) {
    console.log(`TERM for ${whichdoc}: ${results[t][0]} | SCORE: ${results[t][1].toFixed(2)}`)
  }
}

["doc1", "doc2", "doc3"].forEach(d => {getTfIfPerDoc(corpus,d)})
Conclusion and next steps
I must have put between 20 to 25 hours into Starboard, and created about a dozen notebooks. Here are my thoughts so far:
Pros:
- Supports JavaScript and Python
- Stable and reliable
- Free and open-source
- All your favourite JavaScript visualisation packages in one place
Cons:
- Importing packages can be a bit of a hit and miss
- New cells can only be created at the bottom of your notebooks. You then have to manually move them upwards or downwards
- No real dark mode
- No repository of other users’ notebooks to explore
As mentioned earlier on, part II and III of this article will focus on a few other programming languages, including two that I’m not familiar with at all. This is most likely going to be a fun learning exercise, as well as a great opportunity to discover concepts and paradigms that I haven’t really been exposed to yet!
Preview of parts II and II
In the follow-up article, we’ll likly be experimenting with the following notebook environments:
- Typecell for TypeScript
Typecell is a very recent project that as of September 2023 is still in alpha mode, but I must have spent around 5 hours playing around with it. Please note that even though it looks really promising, I’ve had multiple crashes while trying to perform some basic opeations. Actually, even some of the official examples seem to return errors when replicated.
- Livebook for Elixir
Dear reader, do you know what’s awesome about Elixir? I have absolutely zero knowledge of it!
How did I come across Livebook then you might wonder?
I mentioned a few weeks ago in an article dedicated to the Polars dataframe gem for Ruby that I had come across a YouTube video where Elixir was being used as a language for data analysis and data science. Out of boredom curiosity, I decided to spend a bit of time looking for more related content and eventually stumbled upon a couple of interesting conversation threads on HackerNews.
What’s even more awesome here is that Jose Valdim, the creator of Elixir, seems to be actively involved in the development of Livebook.
I’ve heard a lot of praises about Elixir over the past few years, and this feels like a great opportunity to finally lose my sanity with dip my toes in functional programming!